Reports

Every report your team runs, already done.

Accolade turns leasing, maintenance, revenue, and financial data into the reports multifamily teams actually use—delivered on your cadence, with the next action attached.
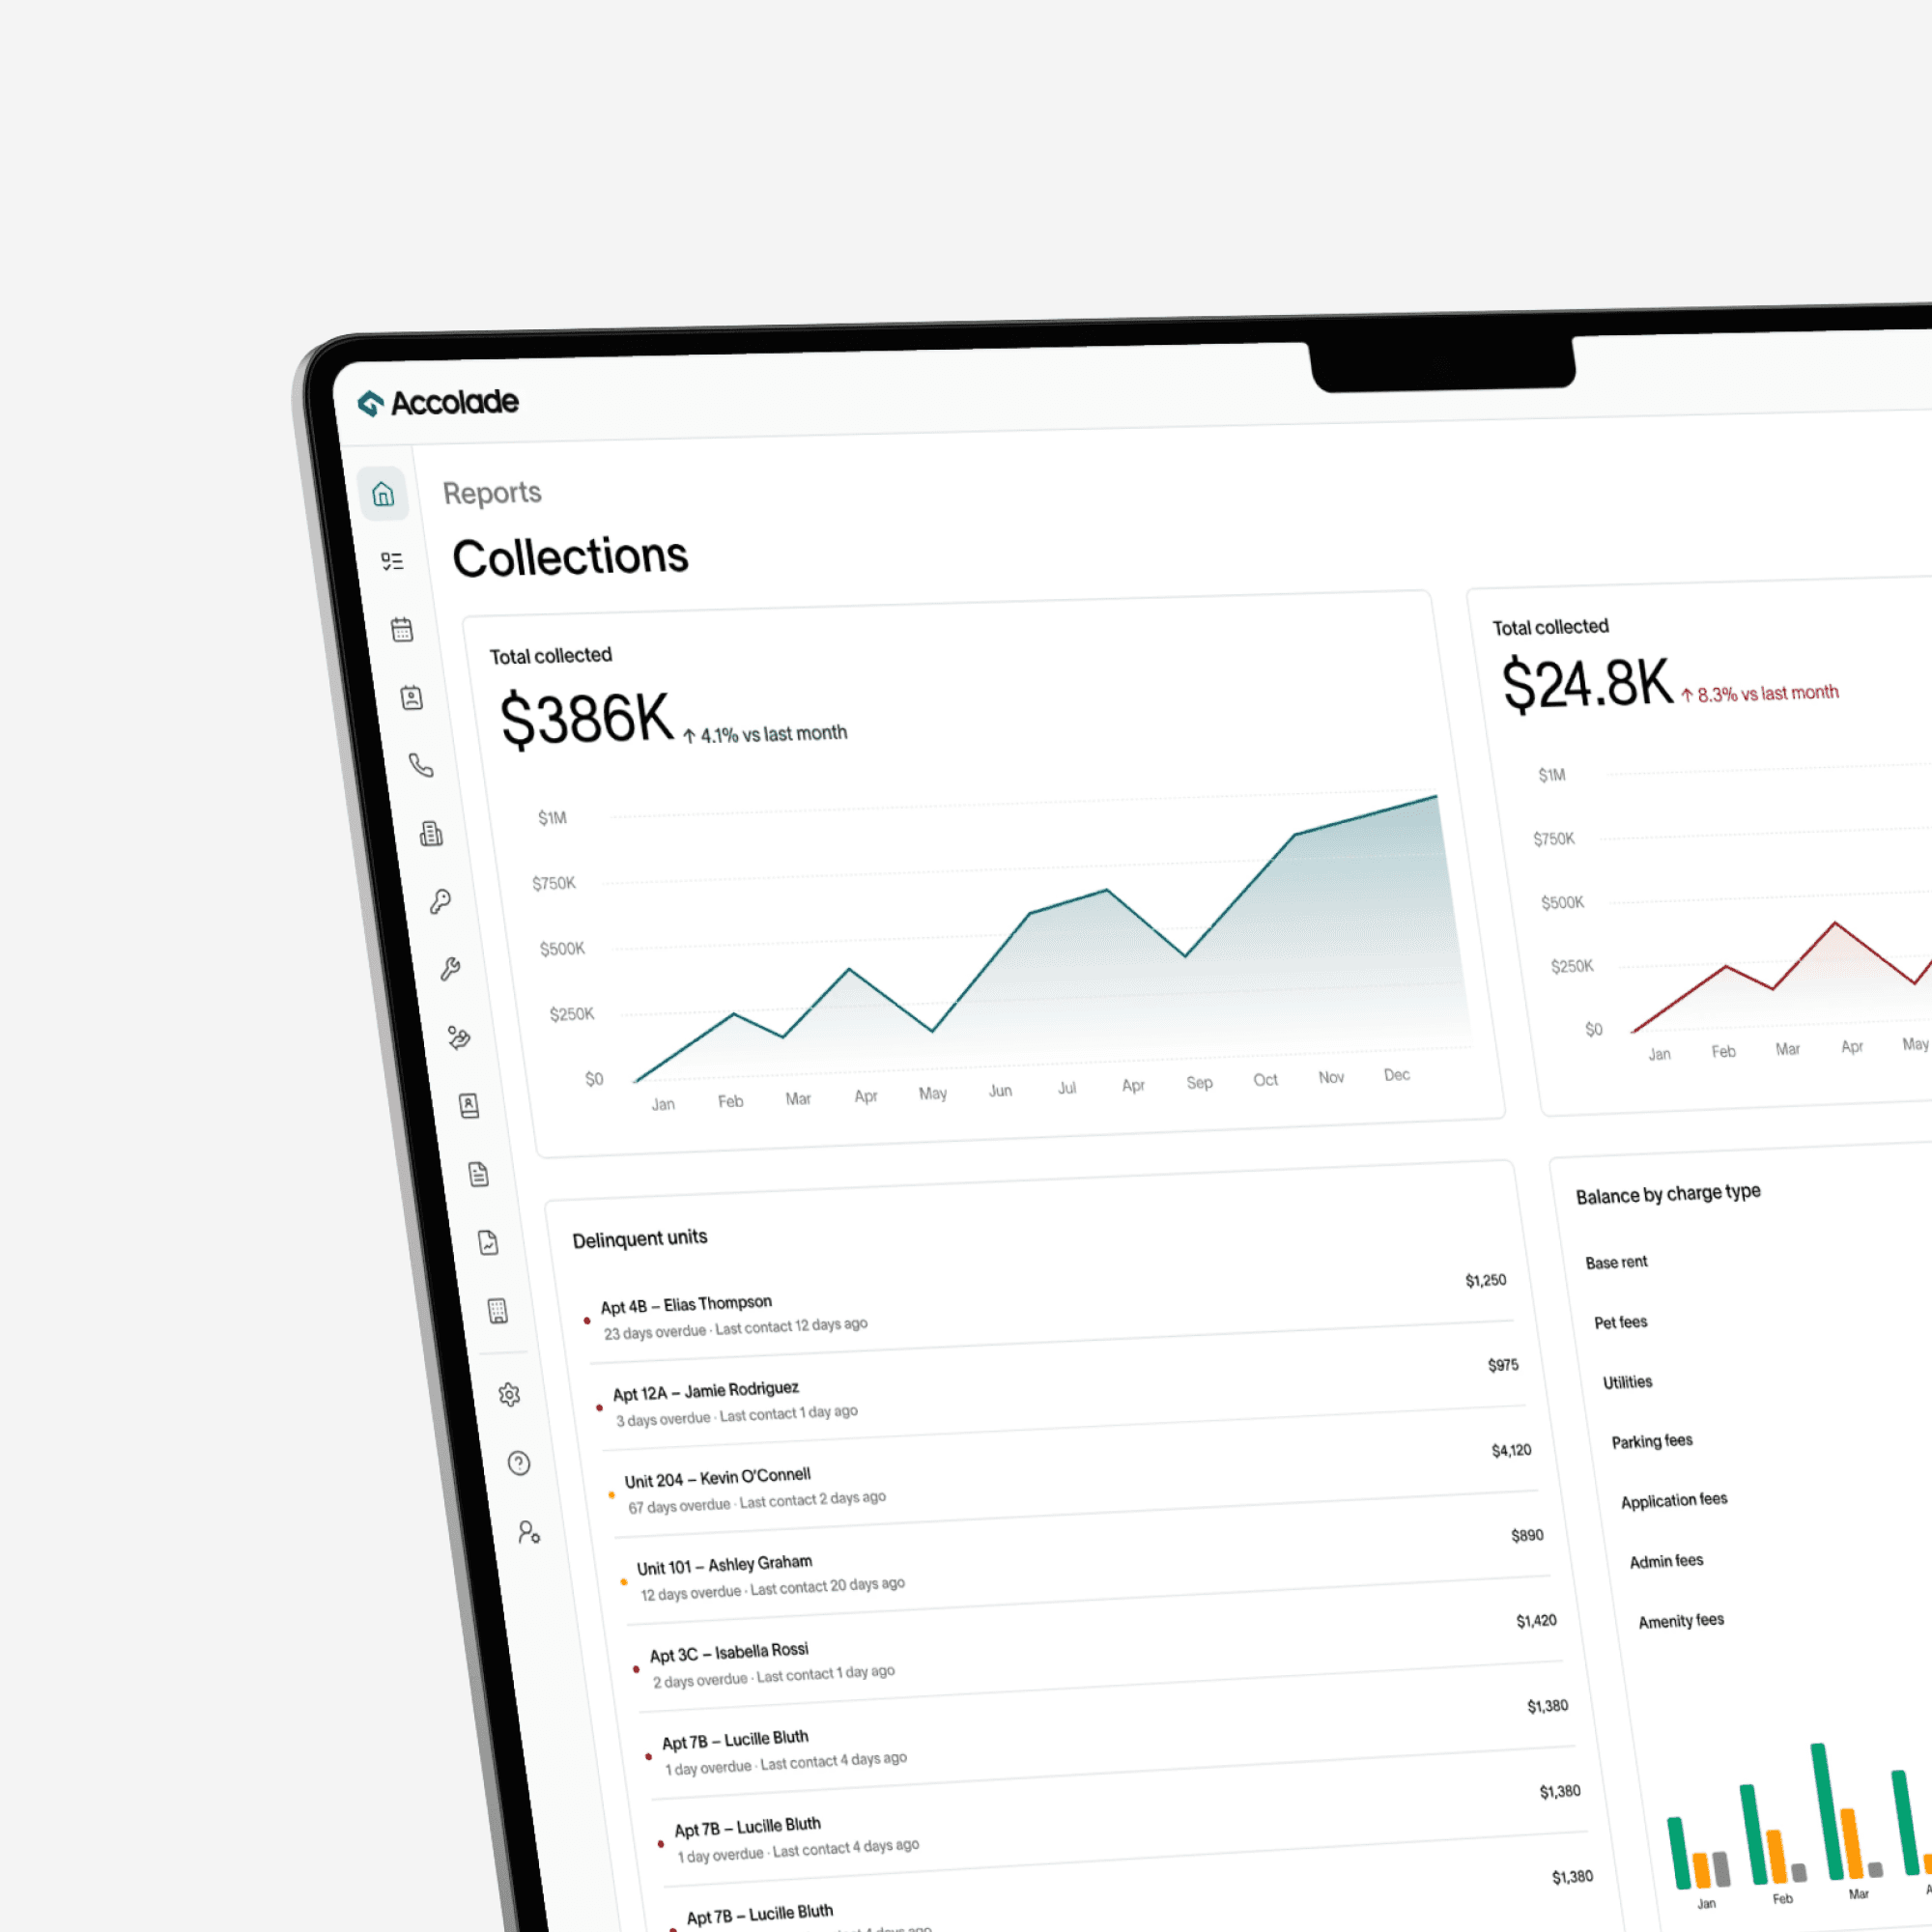
Reporting without the rebuild

Stop assembling reports. Start acting on them

Most teams spend the first hour of every week rebuilding the same spreadsheet. Accolade builds it from governed data, sends it to the people who need it, and keeps the thread of what happened next.

Stop assembling reports. Start acting on them

Most teams spend the first hour of every week rebuilding the same spreadsheet. Accolade builds it from governed data, sends it to the people who need it, and keeps the thread of what happened next.

One set of numbers

Every rent, special, and fee traces back to the unit and the source it came from.

Built for the role

A leasing agent, a maintenance manager, and an asset manager each get the view their day actually needs.

Delivered, not requested

Set the cadence once. Reports arrive before the meeting instead of after someone asks.

A library of reports, prebuilt for multifamily.

Hundreds of standard reports across leasing, operations, maintenance, revenue, and accounting—run at property, group, or portfolio level, then drill straight down to the lease or unit.

A library of reports, prebuilt for multifamily.

Hundreds of standard reports across leasing, operations, maintenance, revenue, and accounting—run at property, group, or portfolio level, then drill straight down to the lease or unit.

Find the report, run it, drill in

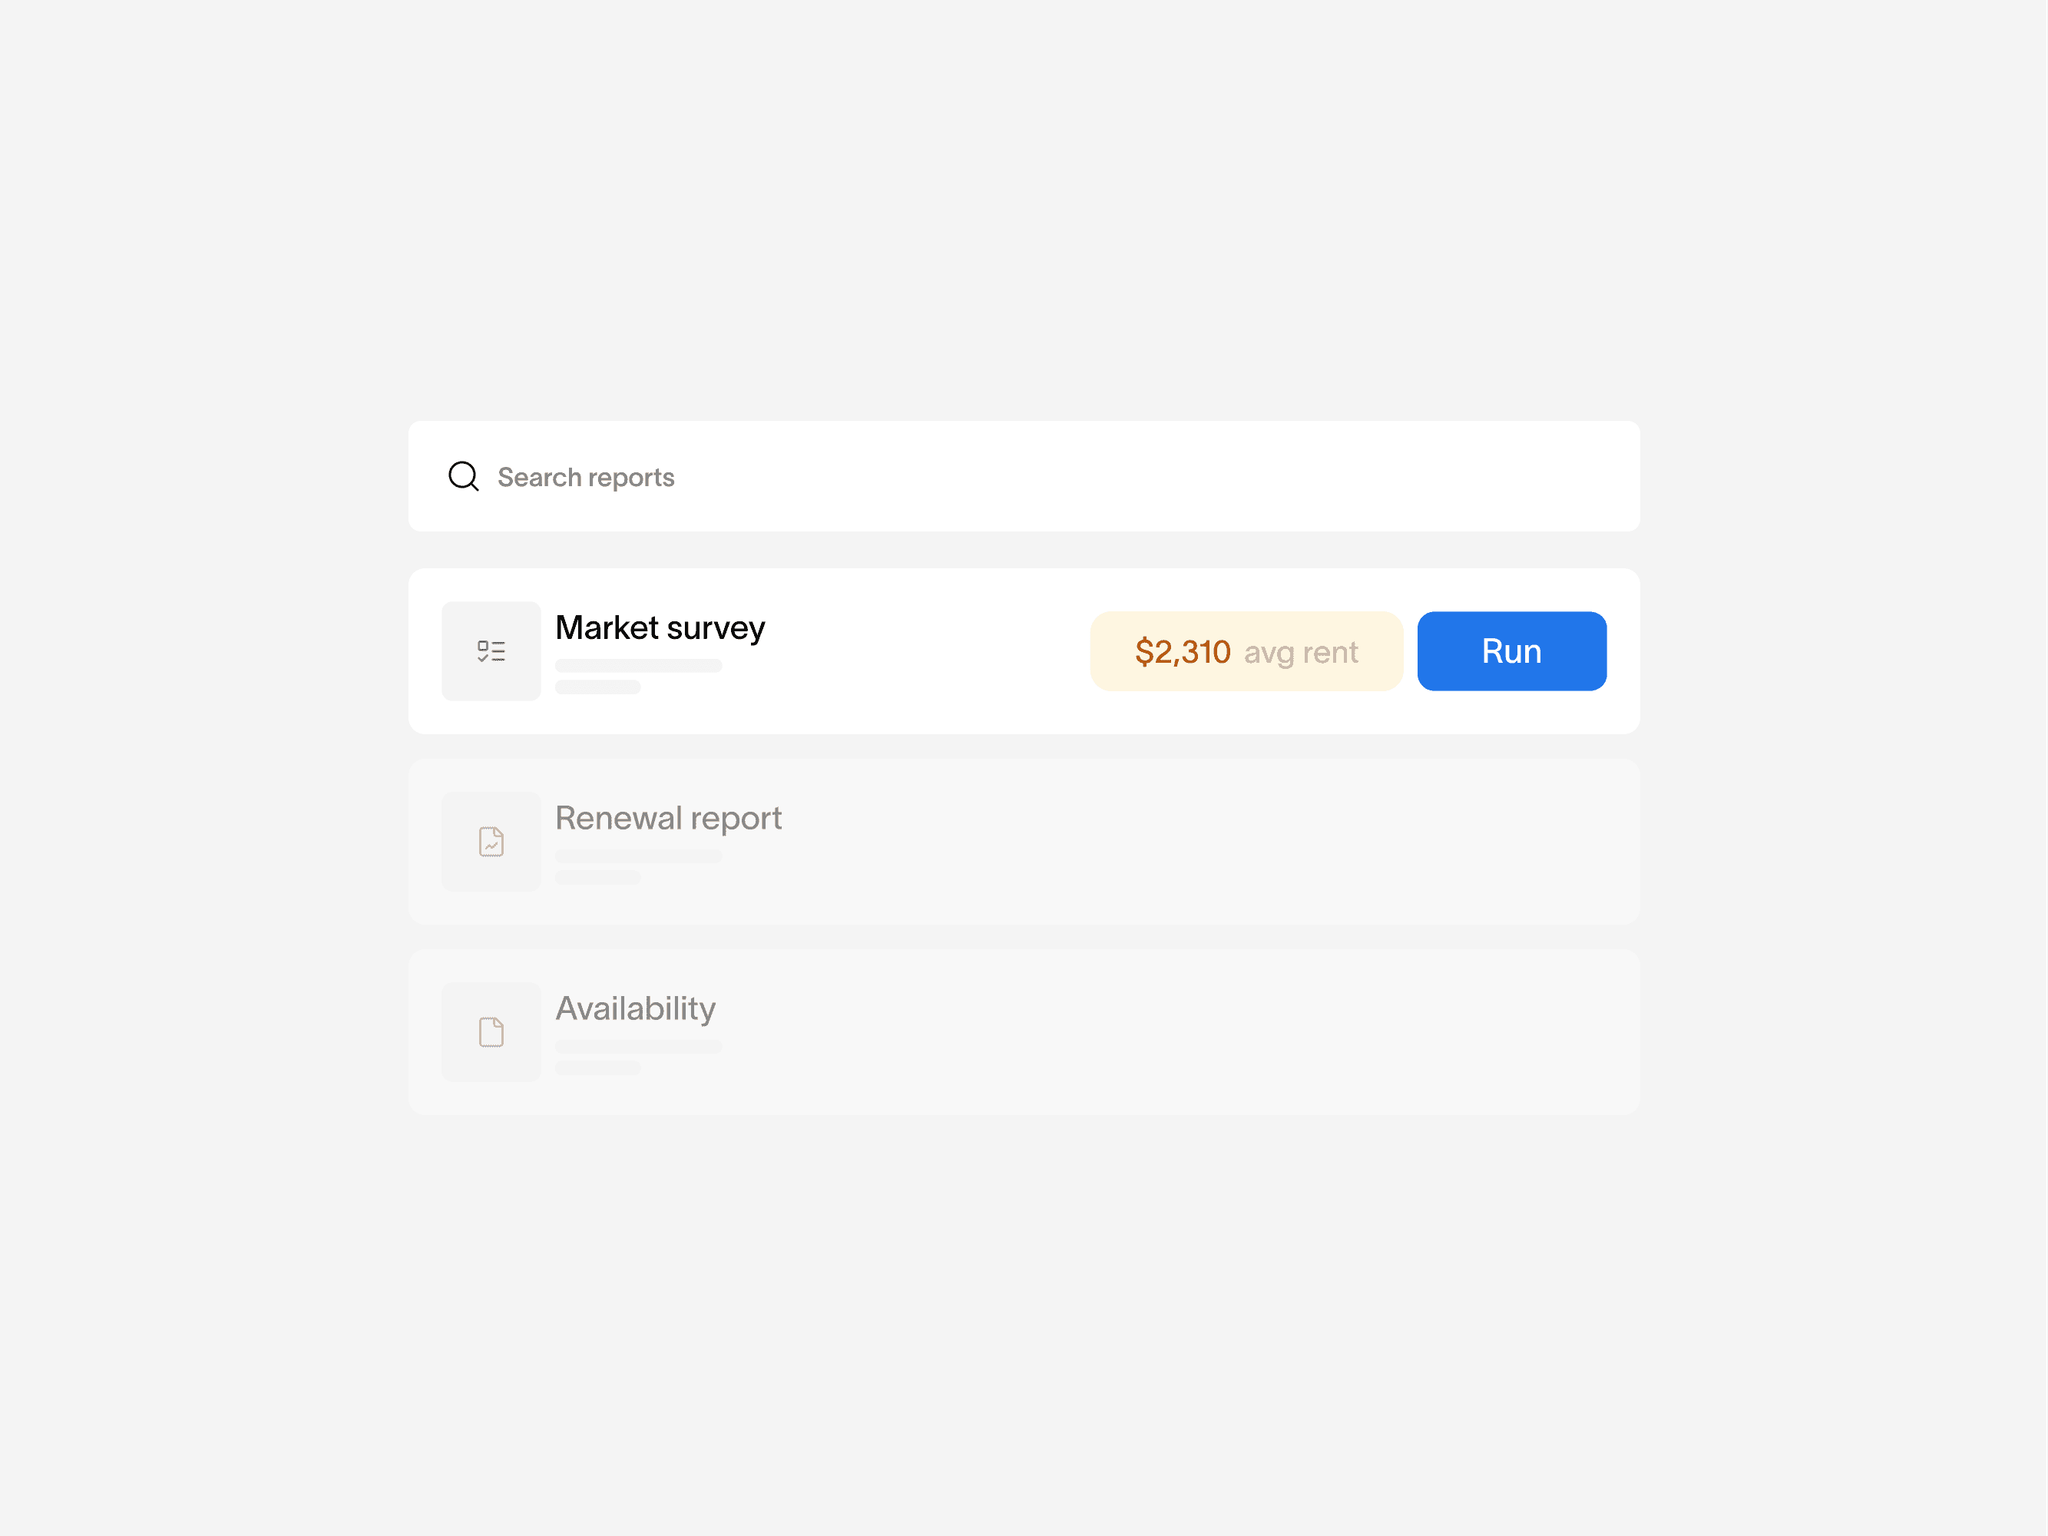
Search the library, filter by category or role, and open any figure down to the lease behind it.

Or build exactly what you need

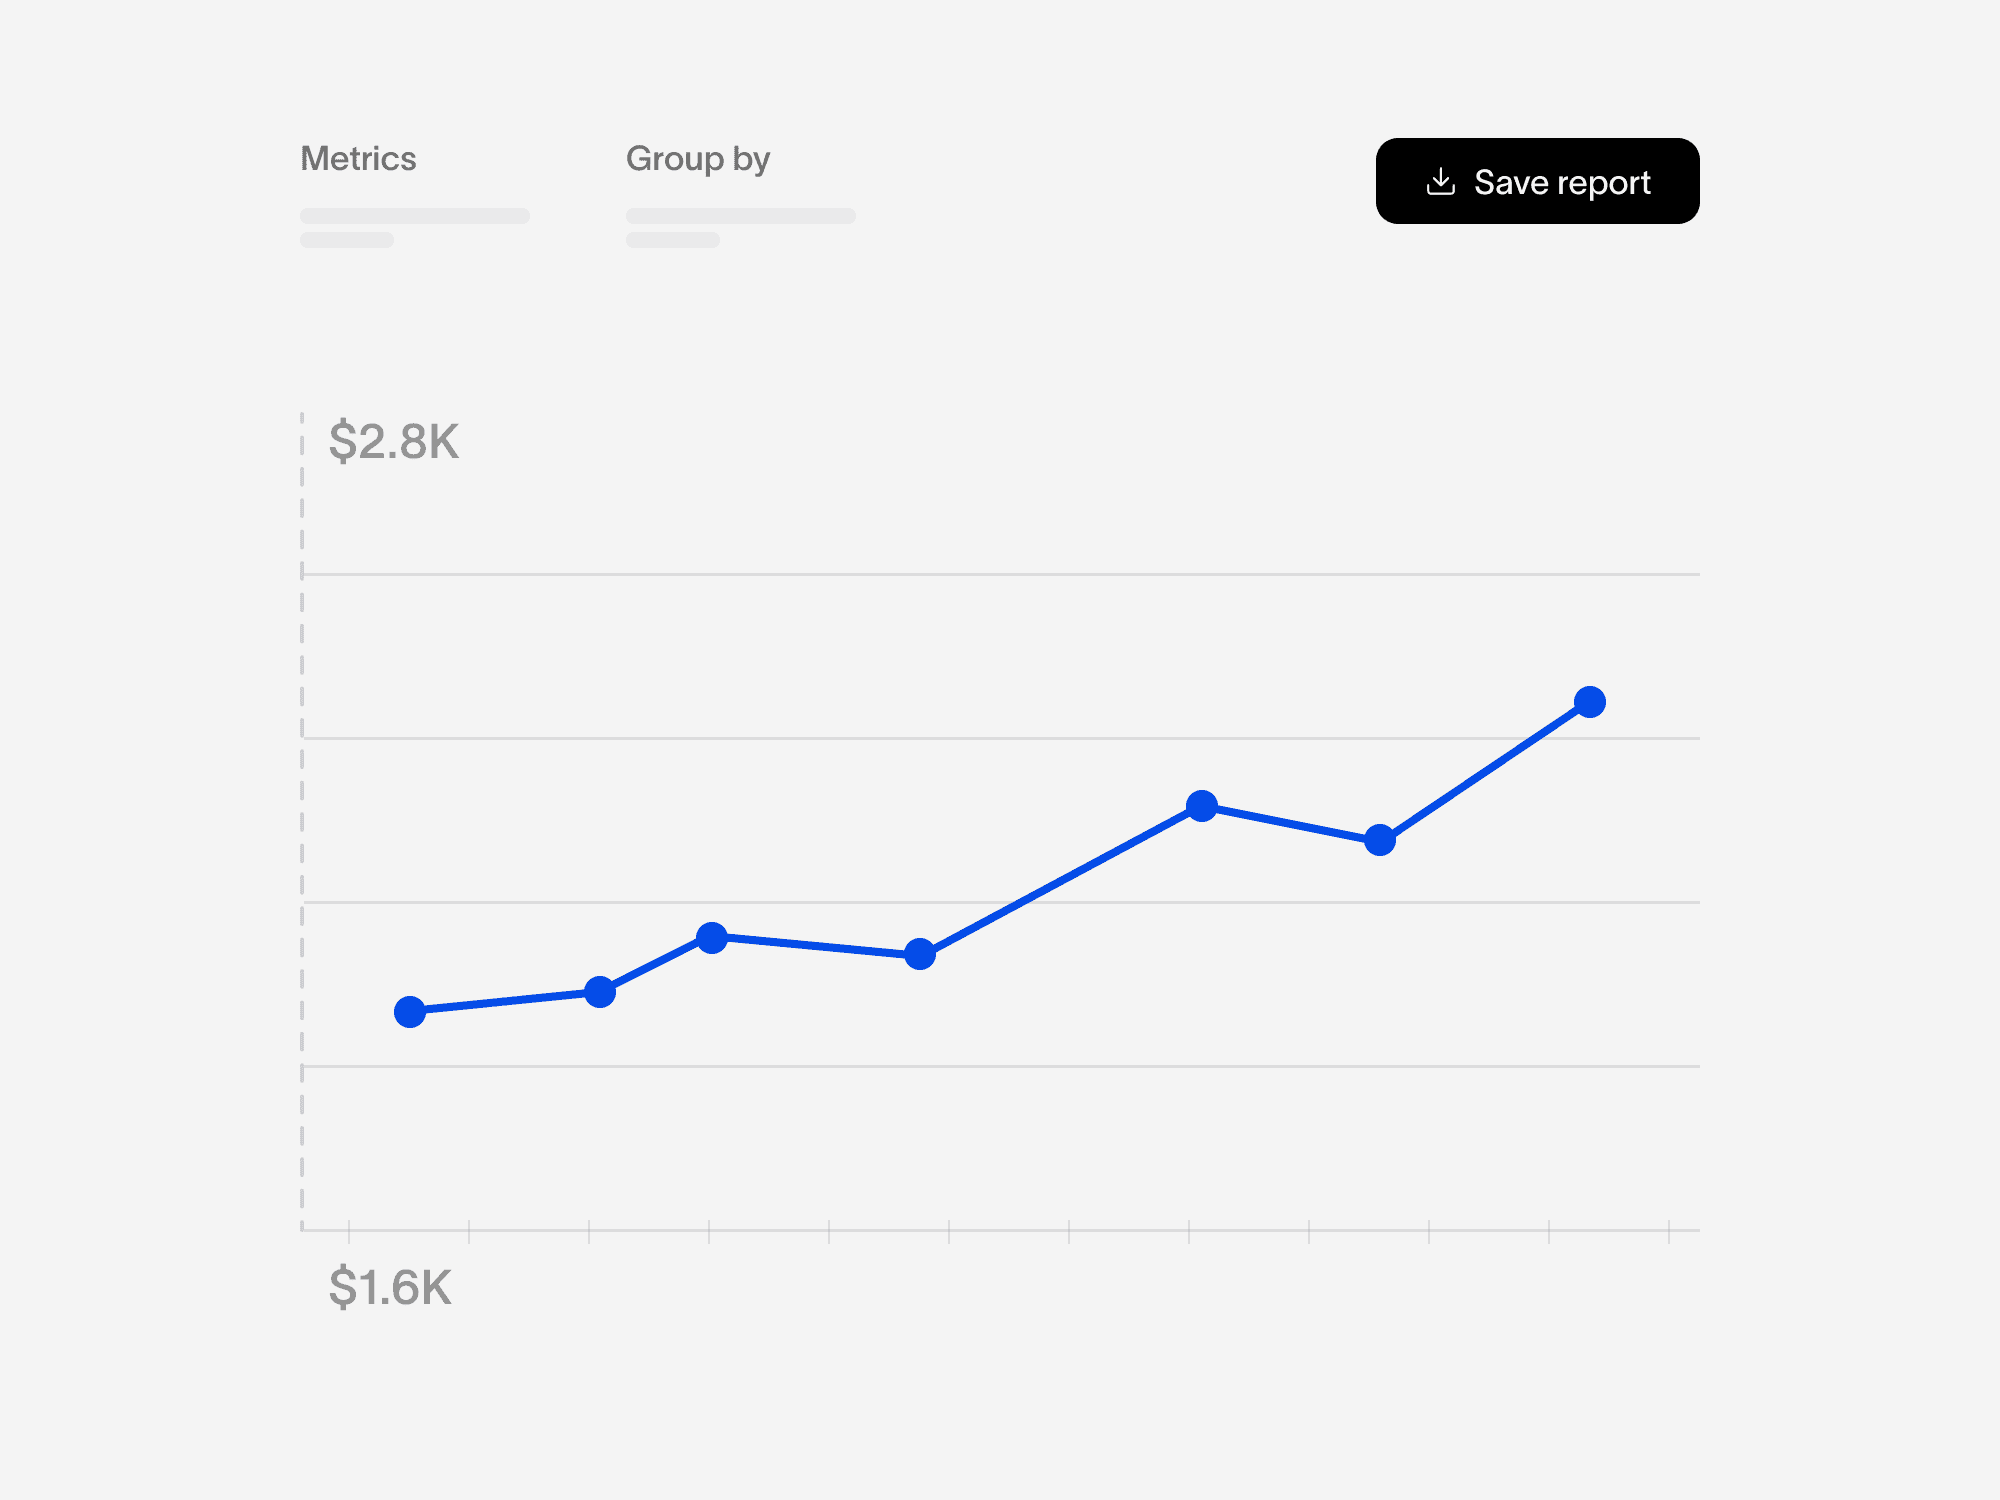
Pick the metrics, group them the way your team thinks, and save it for everyone.

Every corner of the operation.

The metrics multifamily teams are measured on, defined once and calculated the same way in every report.

Every corner of the operation.

The metrics multifamily teams are measured on, defined once and calculated the same way in every report.

Leasing

Traffic, tour-to-application, lead-to-lease conversion, cost per lease, and approval times.

Occupancy

Physical and economic occupancy, exposure, average days vacant, and notice-to-vacate.

Revenue

Effective rent, concession value, trade-out, loss to lease, and other income.

Maintenance

Work order aging, completion time, make-ready turn time, and recurring requests.

Resident

Renewal rate, turnover, satisfaction, and delinquency by resident and unit.

Financial

Budget variance, aged receivables, NOI, and portfolio rollups with approved explanations.

Numbers you can read at a glance.

Every report renders as a chart, not a wall of cells—occupancy trends, leasing funnels, aging buckets, and budget variance drawn the same way in every property and portfolio view.

Numbers you can read at a glance.

Every report renders as a chart, not a wall of cells—occupancy trends, leasing funnels, aging buckets, and budget variance drawn the same way in every property and portfolio view.

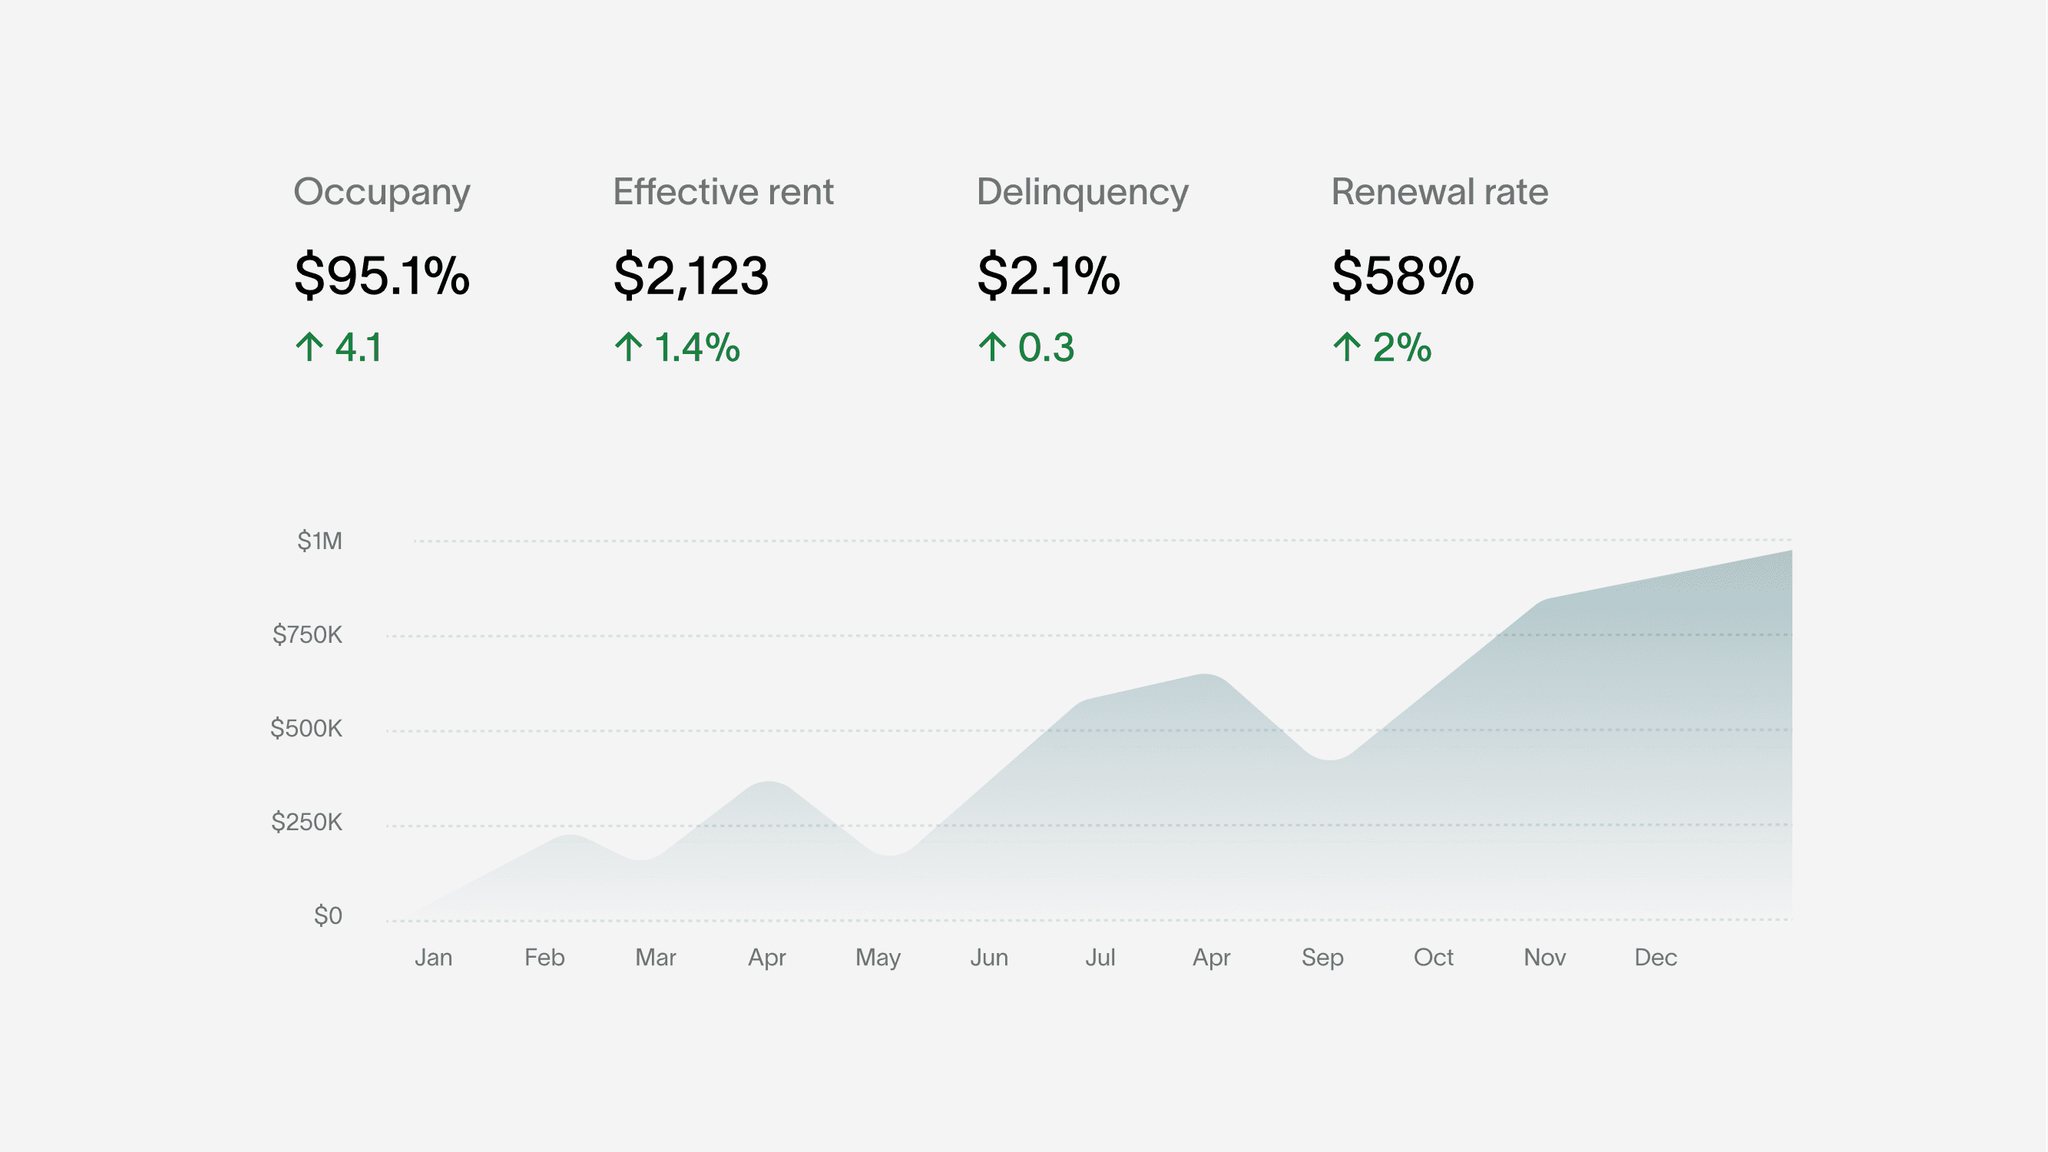
Portfolio performance at a glance

Headline KPIs with the trend behind them, refreshed as the underlying data moves.

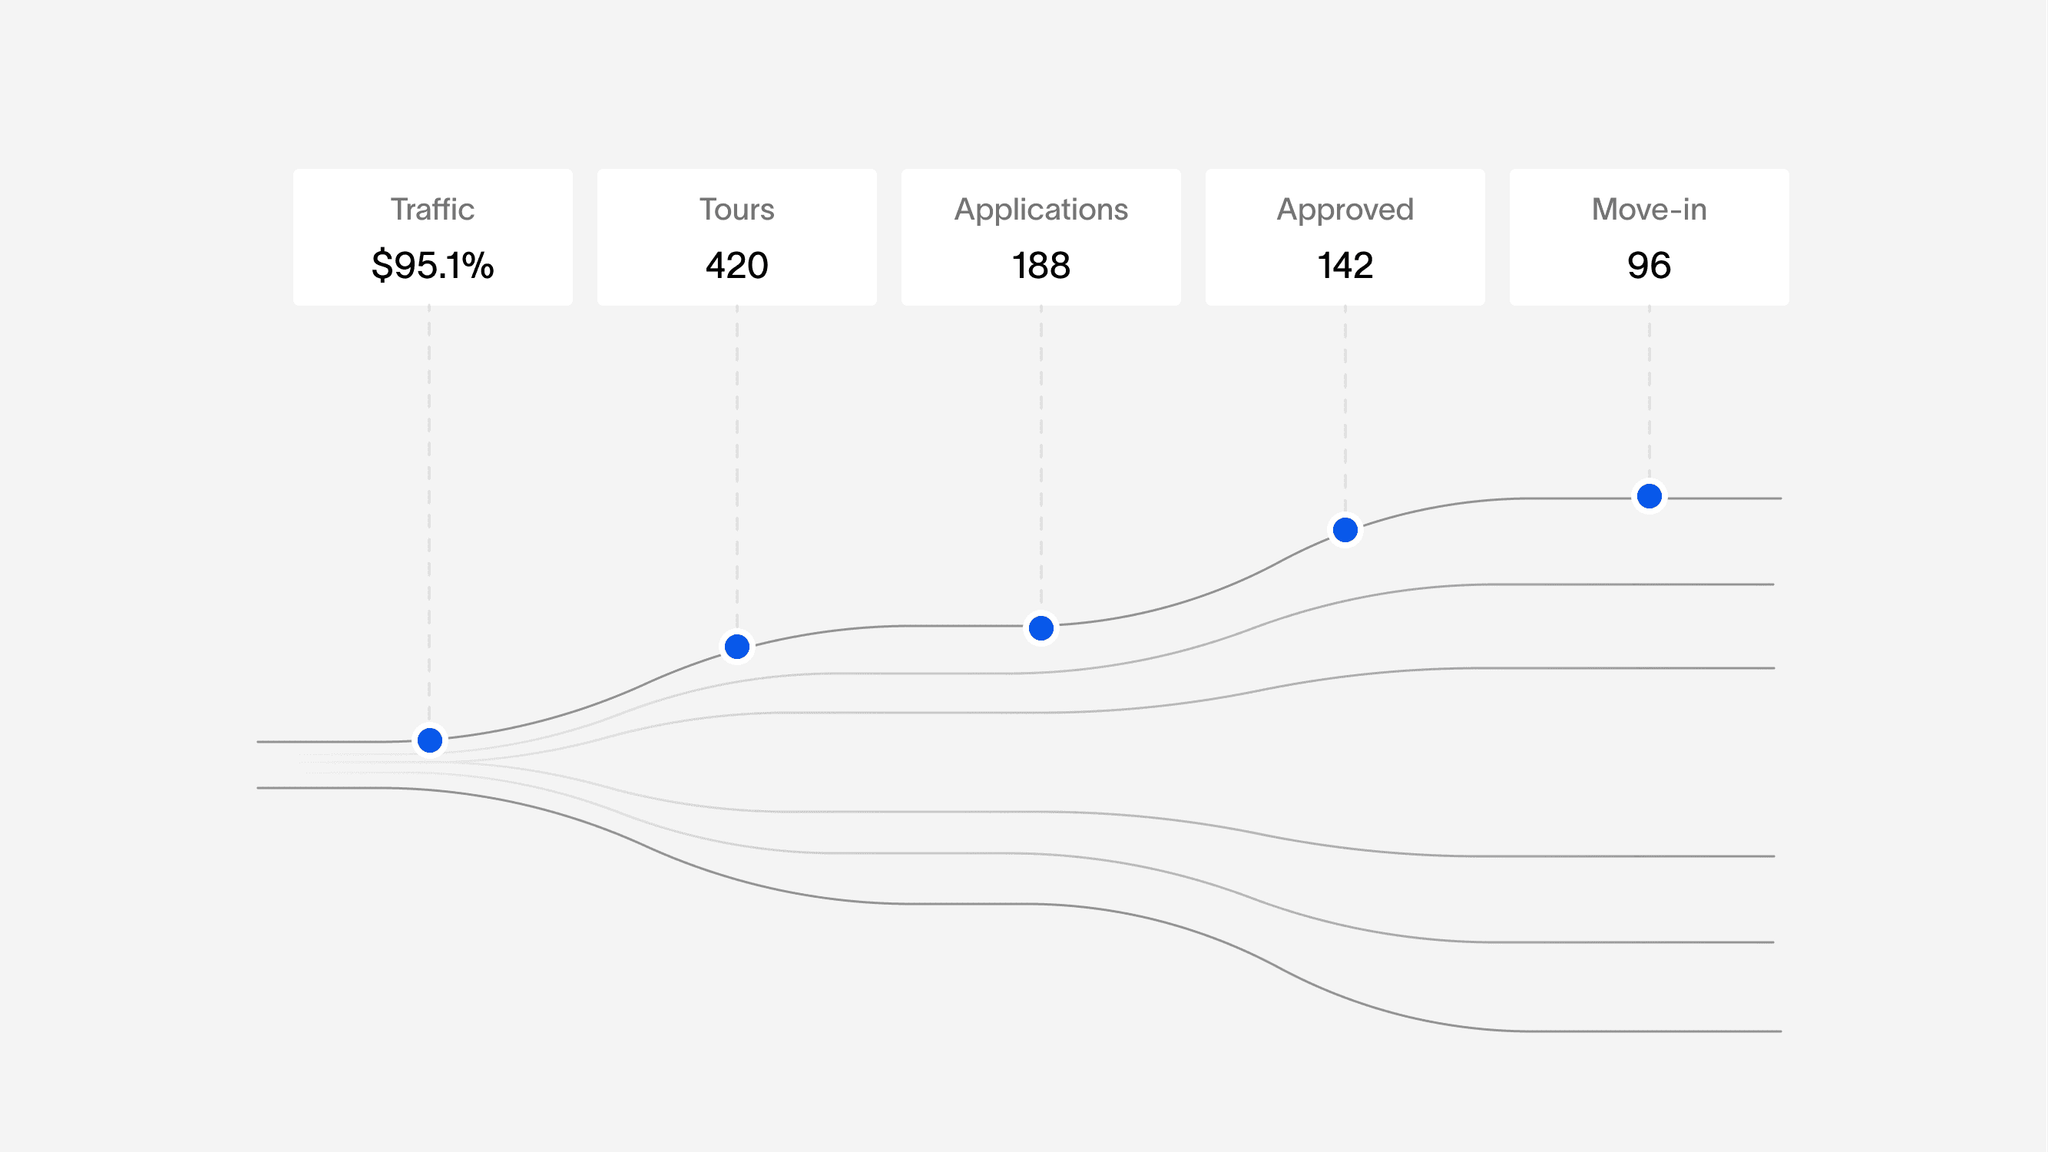
Where leases fall out

Follow traffic through to move-in and see which step is losing the most.

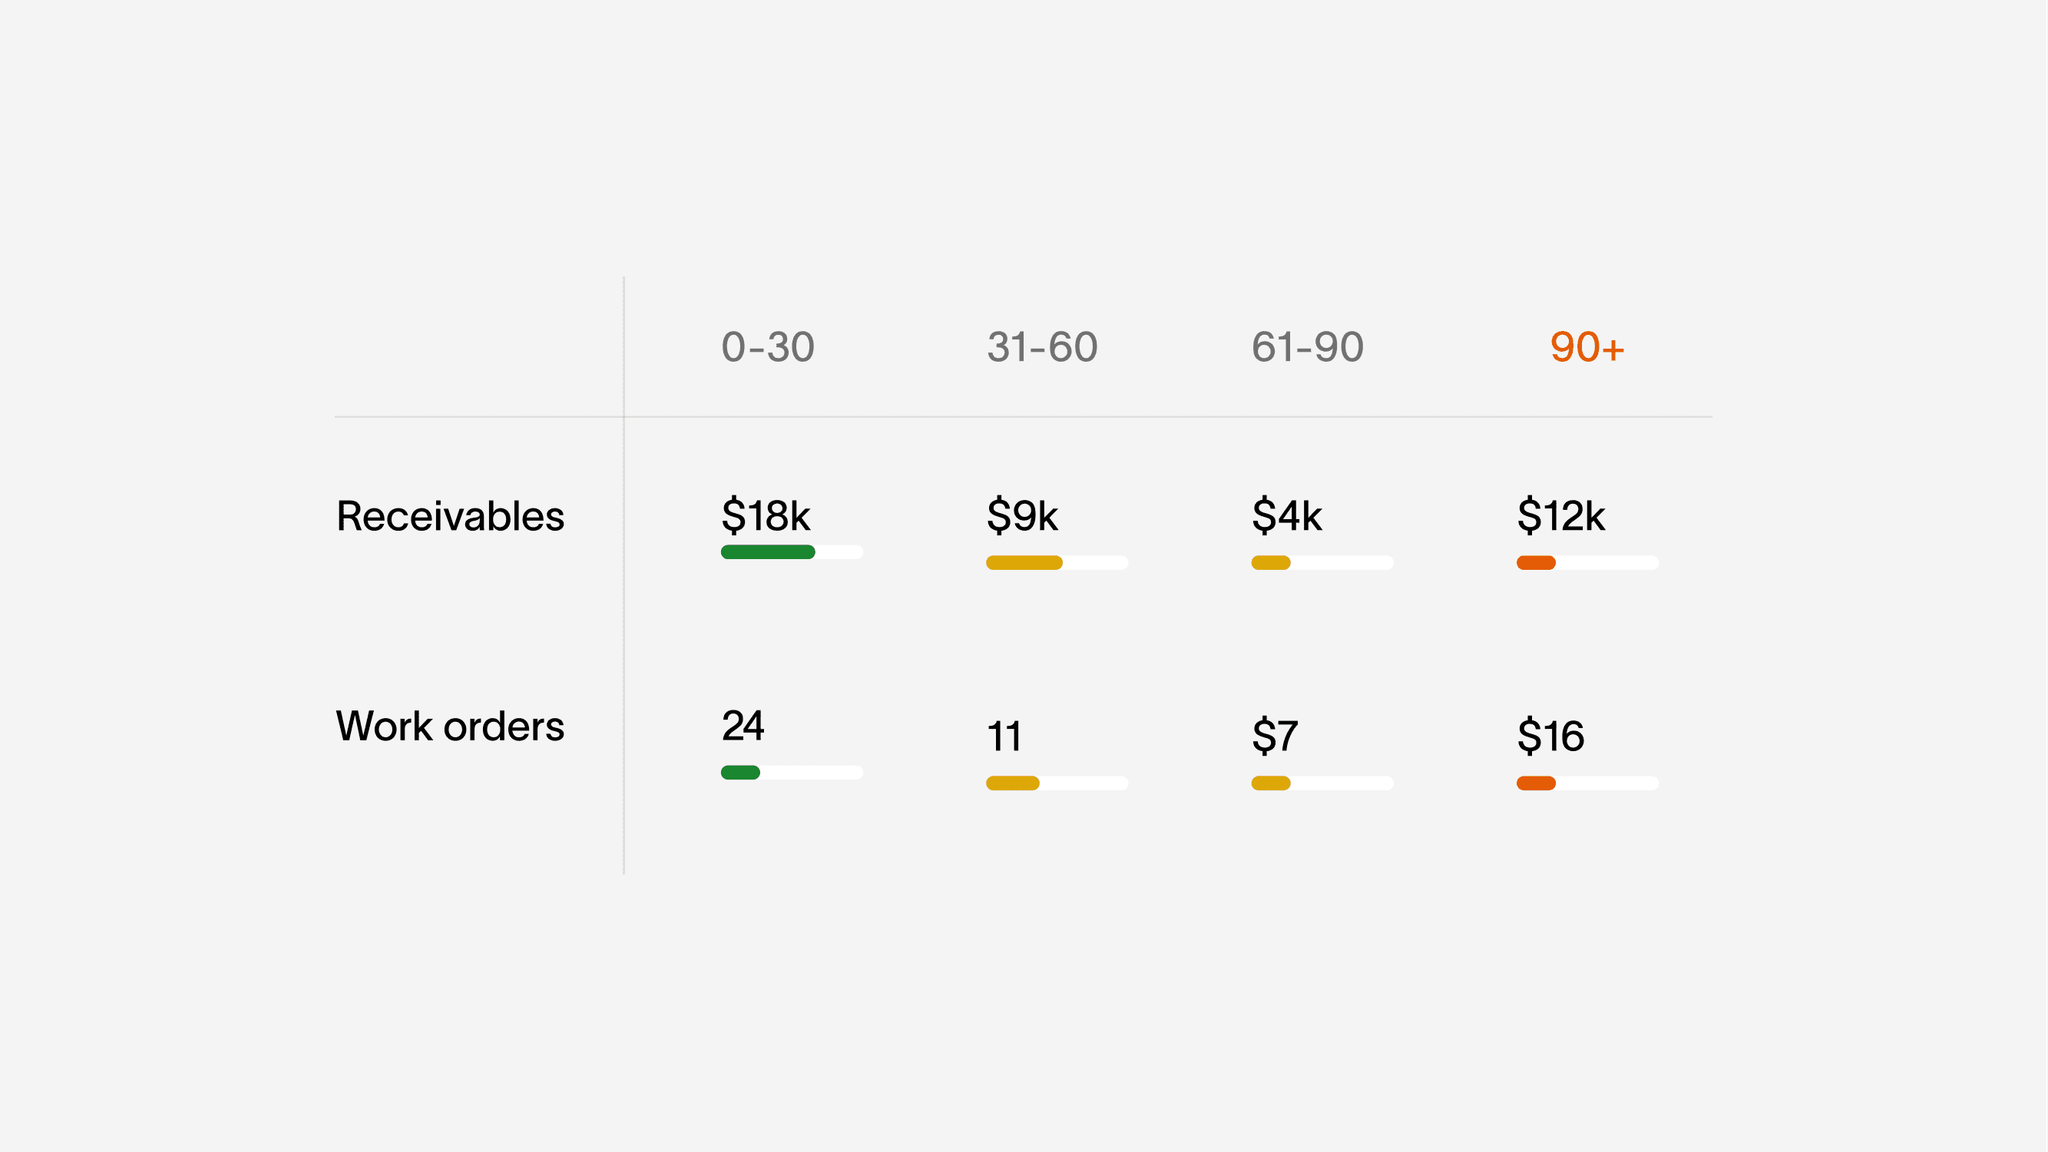
Aging, bucketed

Receivables and work orders grouped the way your team already reviews them.

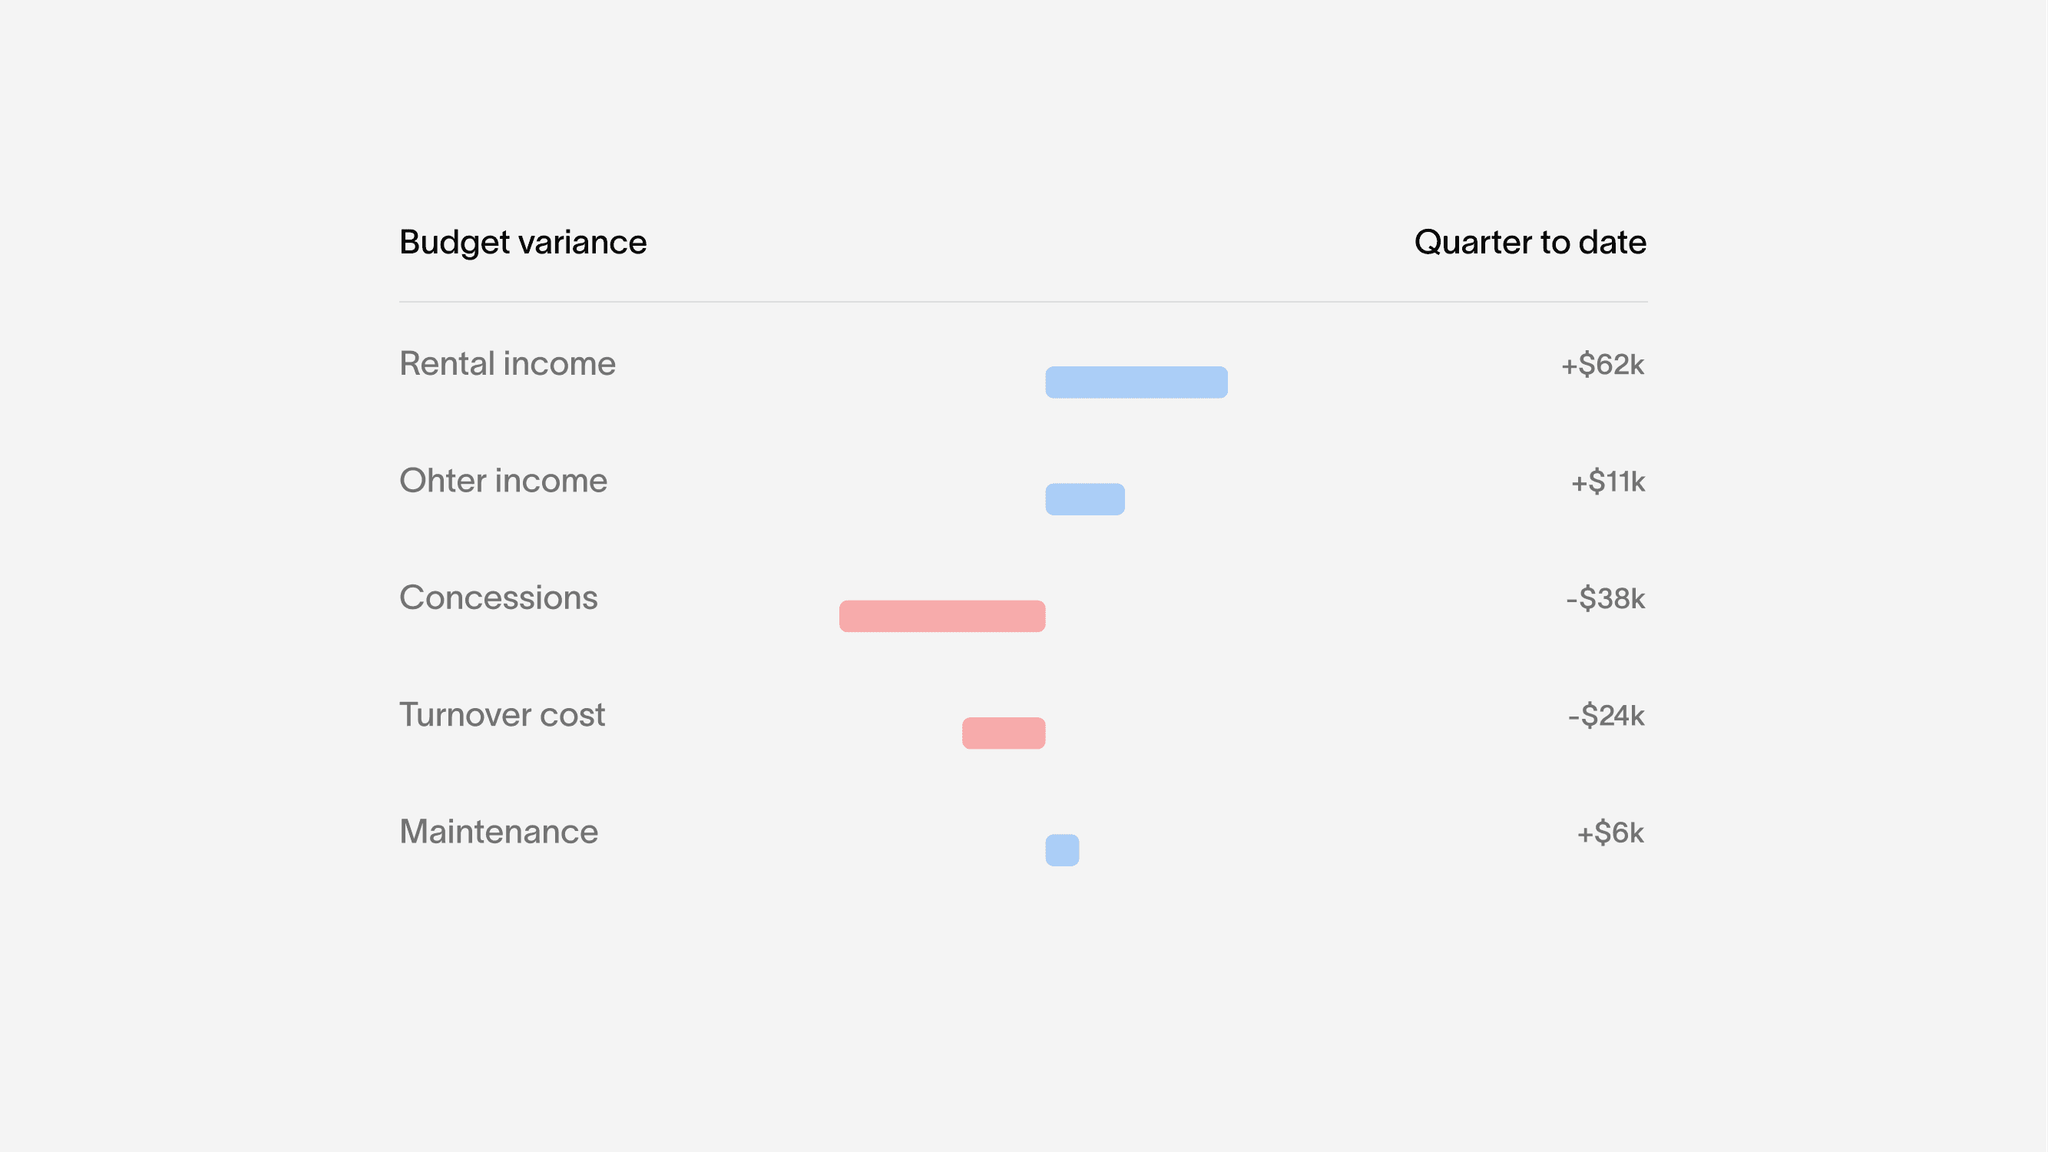
Variance you can defend

Actual against budget by line, with the approved explanation attached to each swing.

Demand and demographics

Household growth, income, and renter profiles for the market you define.

Demand and demographics

Household growth, income, and renter profiles for the market you define.

New supply

Pipeline, unit counts, delivery timing, and lease-up status.

New supply

Pipeline, unit counts, delivery timing, and lease-up status.

Ownership

Verified owner and operator context for any property.

Ownership

Verified owner and operator context for any property.

Transactions

Recent sales, price per unit, and comparable history.

Transactions

Recent sales, price per unit, and comparable history.

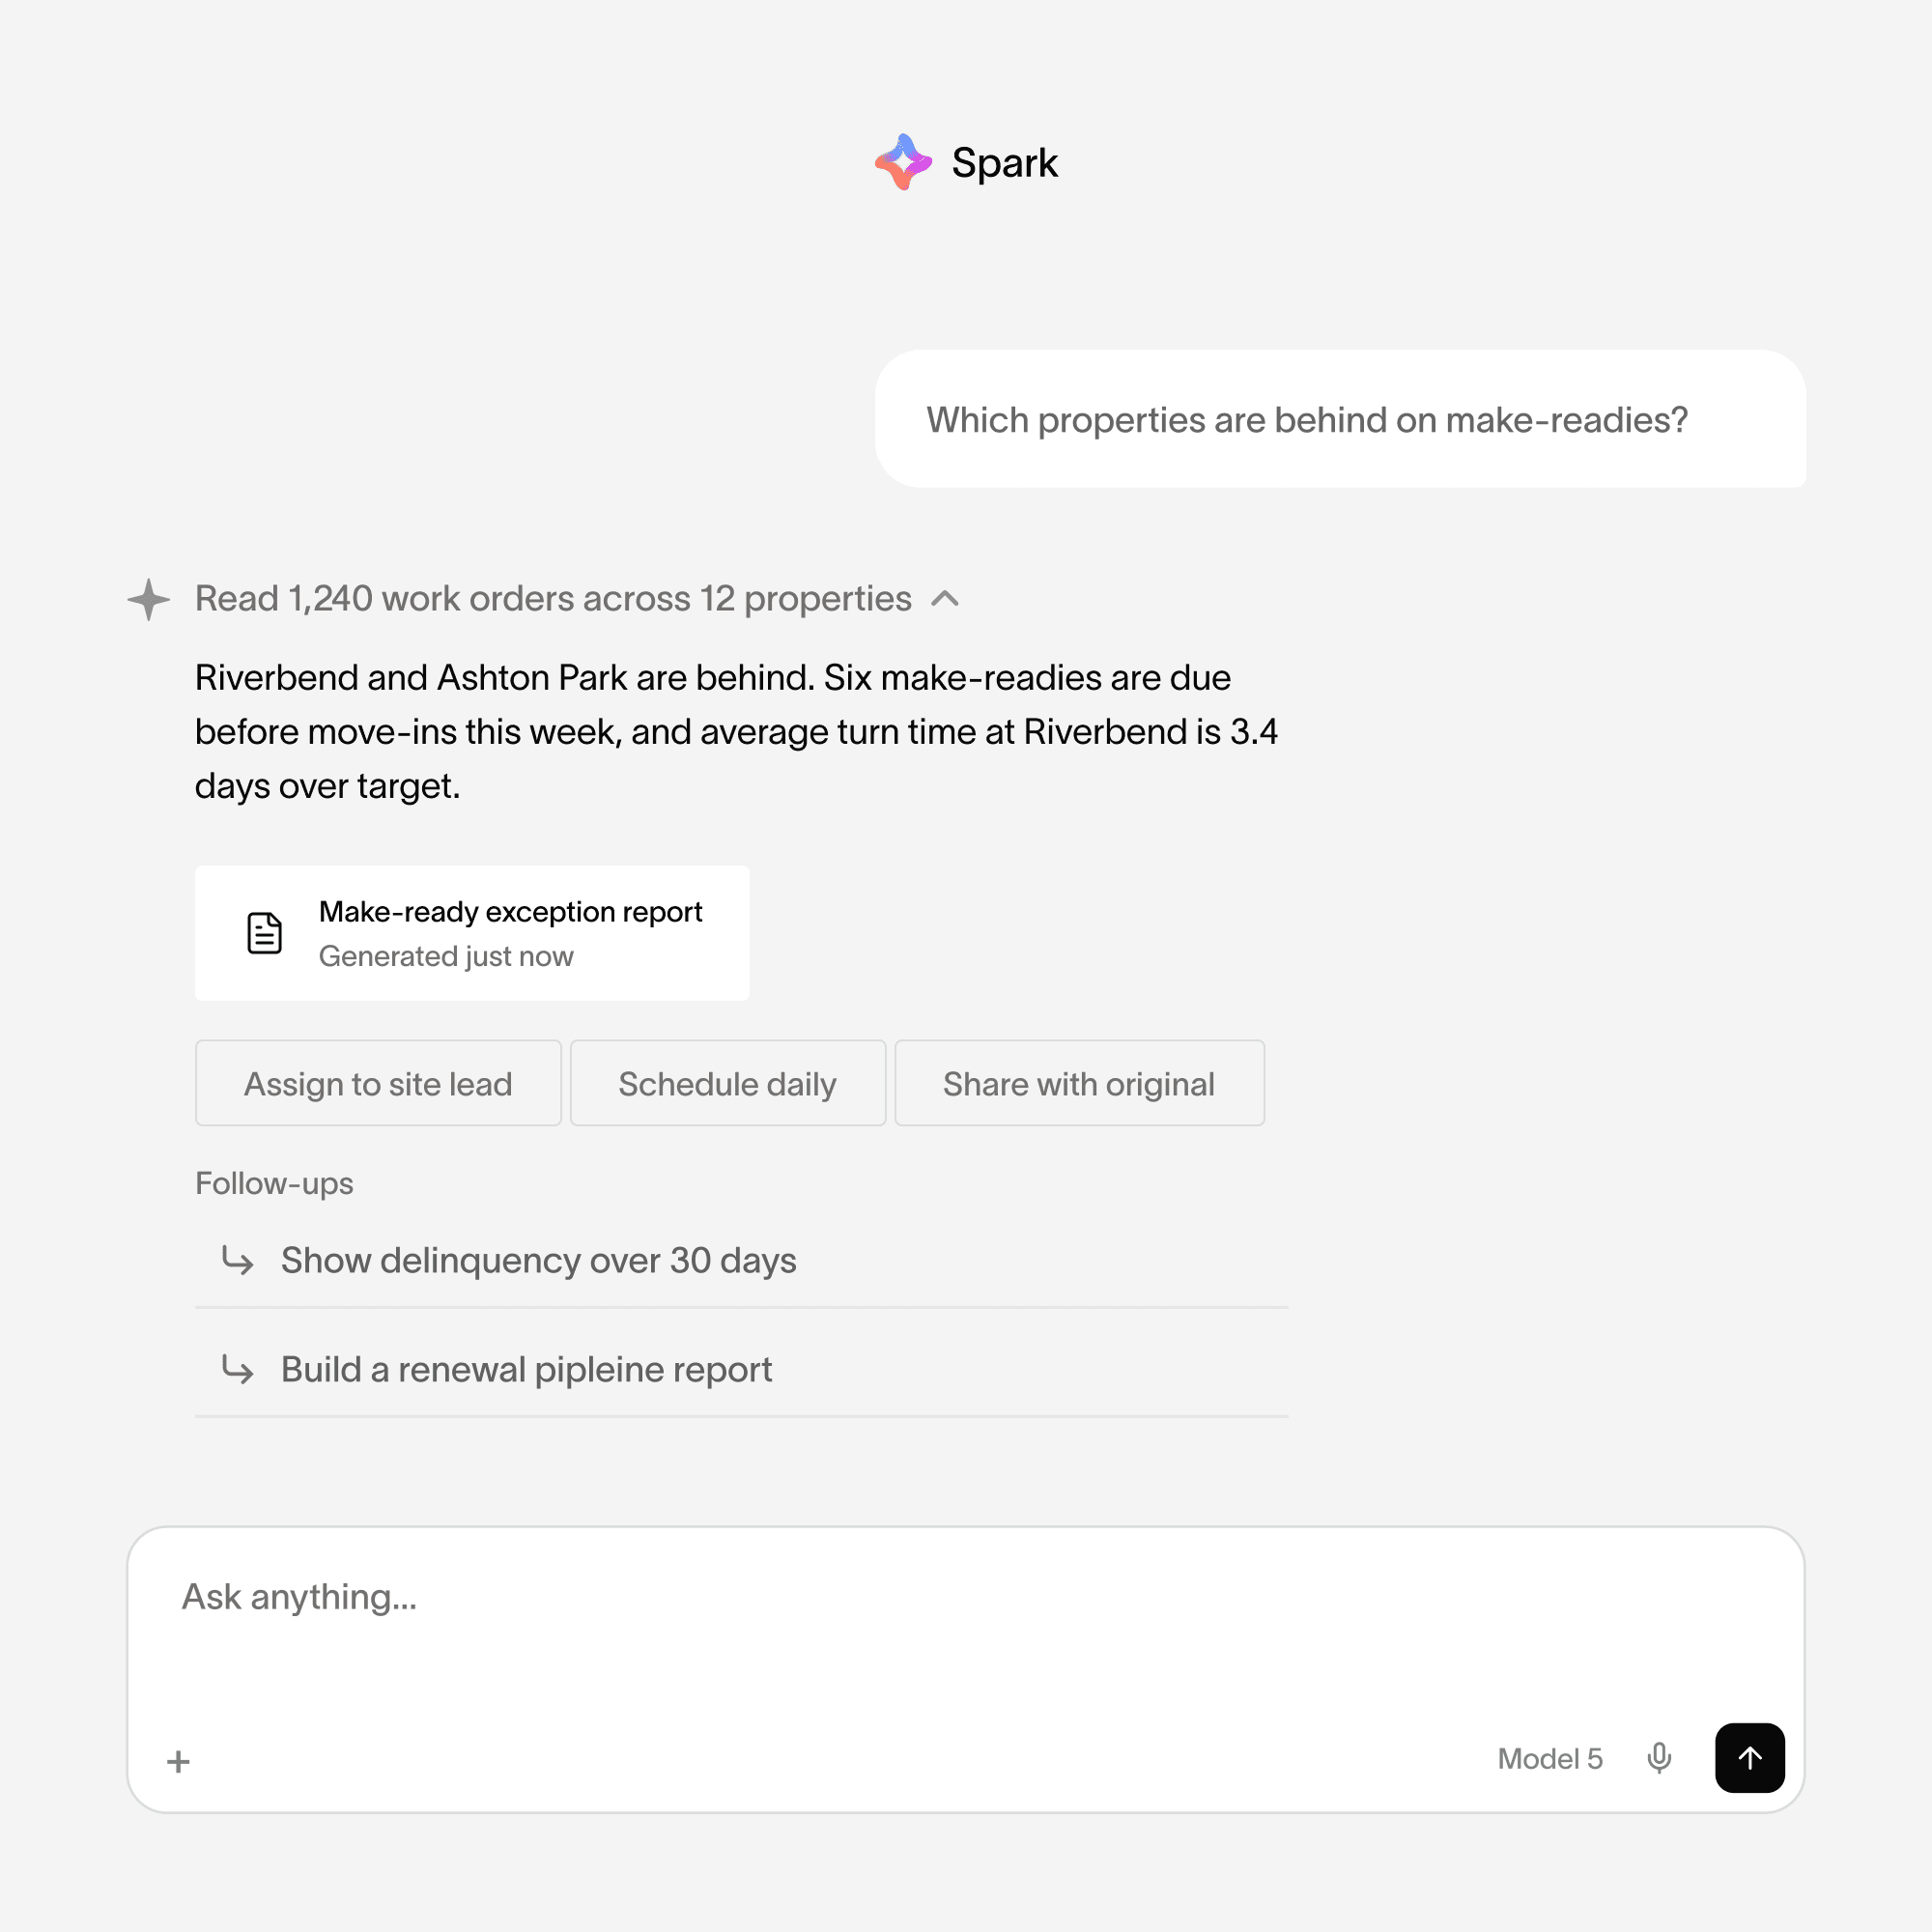
Ask for the report. Take the action.

Spark reads the same governed data, builds the report you asked for, and offers the next step—so the insight turns into work someone owns.

Ask for the report. Take the action.

Spark reads the same governed data, builds the report you asked for, and offers the next step—so the insight turns into work someone owns.

Ask in plain language

No report codes or query builders. Describe what you need the way you would ask a colleague

Get a real report back

Spark produces the same governed report you would have built by hand, ready to share or schedule.

Act without leaving it

Assign the follow-up, set a cadence, or send it on—directly from the answer.

However your audience needs it.

The same governed numbers, shaped for the site team, the regional review, and the owner packet.

However your audience needs it.

The same governed numbers, shaped for the site team, the regional review, and the owner packet.

Scheduled email digests

Daily and weekly summaries sized for a phone, with the detail one tap away.

Owner and investor packets

Month-end reporting with variance explanations and approvals already attached.

Live dashboards

Shared views that refresh on their own, filtered by property, group, or region.

Exports that behave

Excel, CSV, and PDF built from the same definitions, so nothing shifts in translation.

Permissions by role

Site teams see their property. Regionals see their group. Owners see their assets.

Straight into your stack

Deliver to the inbox, channel, warehouse, or portal your teams already work in.

FAQ

Reporting essentials

Do we have to rebuild our existing reports?

Where does the data come from?

Can different roles get different reports?

Can we still drill into the detail?

Is Spark required to use reporting?

Give every team the same numbers.

See how Accolade turns your operating data into reports that arrive on time and lead to action.